In this article, I would like to demonstrate ELK Stack for searching and visualization of ORACLE and MongoDB data, let’s say Good Bye to traditional manual data compilation methods.
What sounds achievable using ELK?
- Leverage Real time Searching/Discovery capabilities
- Real time Dashboard
- Issue Tracking/Trending
- Prevent incidents
- Ease of Troubleshooting
- Provide reporting capabilities to end users, first level analysis done by end users before reaching to Operation Support Group
Different kind of ELK use cases I am exploring or tried so far:
- Oracle Performance Data – i.e. V$ACTIVE_SESSION_HISTORY data
- Oracle Listener logfile
- Oracle Alert log file
- Server LCM data analysis i.e. how many servers are in RHEL5, Server is Virtual or physical etc…
- Oracle database Backup usage for each backup appliance
- MongoDB Documents Replication to Elasticsearch
Step 1 : Download and Install ELK using RPMs
# rpm -ivh elasticsearch-5.0.0.rpm

# rpm -ivh kibana-5.0.0-x86_64.rpm

# rpm -ivh jdk-8u111-linux-x64.rpm

I got some issues related to java, but followed below articles to resolve.

alternatives --install /usr/bin/jar jar /usr/java/jdk1.8.0_111/bin/jar 2

alternatives --install /usr/bin/javac javac /usr/java/jdk1.8.0_111/bin/javac 2

alternatives --set jar /usr/java/jdk1.8.0_111/bin/jar

alternatives --set javac /usr/java/jdk1.8.0_111/bin/javac

export JAVA_HOME=/usr/java/jdk1.8.0_111

export JRE_HOME=/usr/java/jdk1.8.0_111/jre/

export PATH=$PATH:/usr/java/jdk1.8.0_111/bin:/usr/java/jdk1.8.0_111/jre/bin
Java must be installed – https://www.techtransit.org/install-and-upgrade-java-version-on-centos-redhat-and-fedora-linux/#
sysctl -w vm.max_map_count=262144 – https://www.elastic.co/guide/en/elasticsearch/reference/current/vm-max-map-count.html
Step 2 : Modify configuration files for setting up ELK Environment
2.1 Modify /etc/logstash/logstash.yml with below parameter, you can leave default as is if you want.
path.data: /var/lib/logstash
path.config: /etc/logstash/conf.d
config.reload.automatic: true – This will reload pipeline based on configuration changes. For example, if you load new conf file in conf dir, it will automatically check and enable you to start working on them.
2.2 Modify configuration in /etc/kibana/kibana.yml file
server.host: "XXXXXX"

elasticsearch.url: http://XXXXXXX:9200
2.3 Modify /etc/elasticsearch/elasticsearch.yml with below params
network.host: XXXXXXX

http.port: 9200

action.auto_create_index: true  ## This is used for mongodb meta index purpose
Step 3 : Write configuration file and put it under below path
/etc/logstash/conf.d/

You should download this jar file(ojdbc7.jar) from Oracle support for Oracle database connection

Below is sample file,

input {

    jdbc {

        jdbc_validate_connection => true

        jdbc_connection_string => "jdbc:oracle:thin:@server1:1521/db1"

        jdbc_user => "XXXX"

        jdbc_password => "XXXX"

        jdbc_driver_library => "/opt/ojdbc7.jar"

        jdbc_driver_class => "Java::oracle.jdbc.driver.OracleDriver"

        statement => "select * from XXXXX"

        schedule => "*/2 * * * *"

       }

}

output {

elasticsearch {

hosts => ["<hostname>:9200"]

index => "logstash-"

}

}
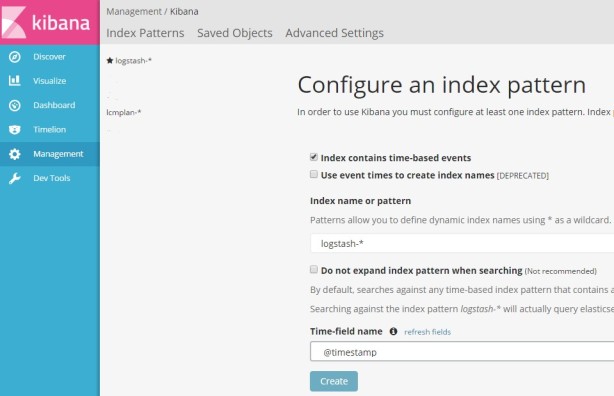
Step 4 : Login to kibana using web browser
First you need to create index with some timestamp field based on your table data.
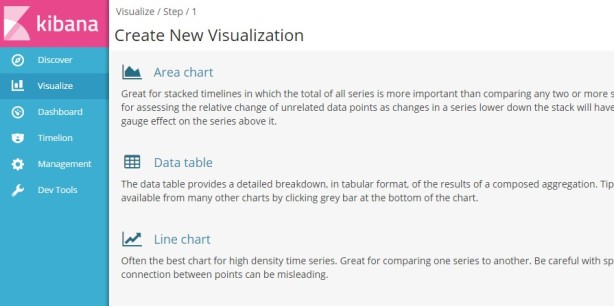
Then you can create new visualization using below, you will see so many different charting options here.
Once you are done with creating visualization, you can add all created visualization in Dashboard.
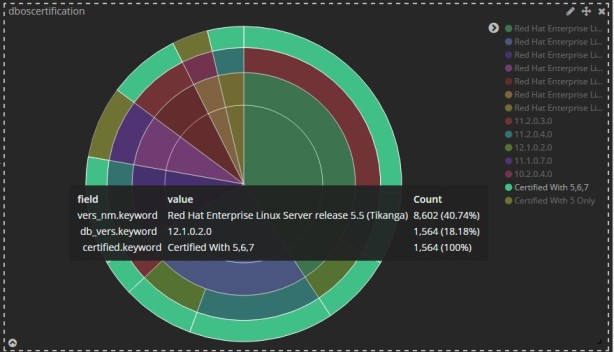
I’ve created dashboard of LCM data. Let me explain more here.
Created centralize table in Oracle database and each server loading it’s data to this centralize table like OS version, physical or virtual, db version etc.. Configured this table in ELK for visualization and reporting.
Now let’s say management wants to see how many servers are in RHEL5 which needs to be upgrade, they can just click on rhel5 and it will filter only servers which are on rhel5. Based on filter you apply, all different visualization will get changed in the same dashboard, here I have applied filter on first circle, so we can see all other circles changed accordingly. Someone may ask how many physical or virtual servers we have, we can filter that using below. This is all real time data rather preparing excel manually on ad-hoc basis.

Let’s talk about MongoDB documents storing and searching through Elasticsearch
Reference Article: https://www.linkedin.com/pulse/5-way-sync-data-from-mongodb-es-kai-hao
Please follow steps as mentioned above for ELK installation/configuration.
Note: I am installing mongo and ELK on same machine for this prototype.
Step 1 : Mongo Install
rpm -ivh mongodb-enterprise-tools-3.2.10-1.el7.x86_64.rpm

rpm -ivh mongodb-enterprise-shell-3.2.10-1.el7.x86_64.rpm

rpm -ivh mongodb-enterprise-mongos-3.2.10-1.el7.x86_64.rpm

rpm -ivh mongodb-enterprise-server-3.2.10-1.el7.x86_64.rpm
Step 2 : We need to install/configure mongo-connector to achieve this milestone.

Check about python install and run below command accordingly
tar -xvf Python-2.7.13.tgz
You need to install python and configure pip before you run below for installing mongo connector
/opt/python/bin/pip install mongo-connector[elastic5]
Step 3 : We need to configure mongo replicaset to achieve mongo document replication to elasticsearch
mongod --port 27017 --dbpath /var/lib/mongo --replSet rs0 --smallfiles --oplogSize 50 --fork --logpath /var/log/mongodb/rs_master.log

mongod --port 27018 --dbpath /var/lib/mongo/rps1 --replSet rs0 --fork --smallfiles --oplogSize 50 --logpath /var/log/mongodb/rps1.log

mongod --port 27019 --dbpath /var/lib/mongo/rps2 --replSet rs0 --fork --smallfiles --oplogSize 50 --logpath /var/log/mongodb/rps2.log

[root]# ps -ef |grep mongo

root      3636     1  0 21:01 ?        00:00:14 mongod --port 27017 --dbpath /var/lib/mongo --replSet rs0 --smallfiles --oplogSize 50 --fork --logpath /var/log/mongodb/rs_master.log

root      3704     1  0 21:01 ?        00:00:12 mongod --port 27018 --dbpath /var/lib/mongo/rps1 --replSet rs0 --fork --smallfiles --oplogSize 50 --logpath /var/log/mongodb/rps1.log

root      3777     1  0 21:01 ?        00:00:13 mongod --port 27019 --dbpath /var/lib/mongo/rps2 --replSet rs0 --fork --smallfiles --oplogSize 50 --logpath /var/log/mongodb/rps2.log

root      5720 30763  0 21:36 pts/1    00:00:00 grep --color=auto mongo
Step 4 : Load some sample data in mongodb
I found some sample json data online, so loading the same for this prototype testing.
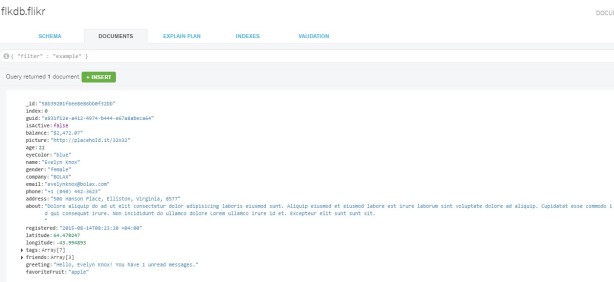
mongoimport --db usdb --collection uszip --file zips.json

mongoimport --db flkdb --collection flikr --file flikr.json

mongoimport --db wbank --collection bank --file world_bank.json

MongoDB Enterprise rs0:PRIMARY> show dbs

fbdb    0.000GB

flkdb   0.000GB

hotels  0.000GB

local   0.004GB

smdb    0.000GB

usdb    0.002GB

wbank   0.001GB
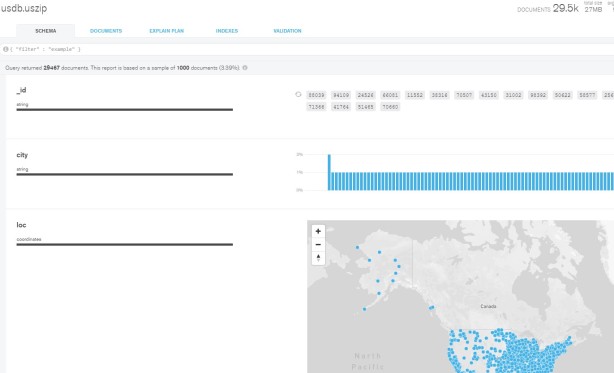
I am using MongoDB Compass to explore above loaded documents, see below.
Step 5 : Launch mongo-connector
cd /opt/python/bin

./mongo-connector -m localhost:27017 -t localhost:9200 -d elastic2_doc_manager

./mongo-connector -m localhost:27017 -t localhost:9200 -d elastic2_doc_manager --auto-commit-interval=0
tail -200f /opt/python/bin/mongo-connector.log – please issue this command for checking mongo connector log.
curl http://server1:9200/hotels/_search/?pretty=1 – Please issue this command to verify whether documents getting inserted in elasticsearch
# curl http://server1:9200/hotels/_search/?pretty=1

{

  "took" : 1,

  "timed_out" : false,

  "_shards" : {

    "total" : 5,

    "successful" : 5,

    "failed" : 0

  },

  "hits" : {

    "total" : 1,

    "max_score" : 1.0,

    "hits" : [

      {

        "_index" : "hotels",

        "_type" : "restaurants",

        "_id" : "58abb6391896ccd6a8ec2311",

        "_score" : 1.0,

        "_source" : {

          "cuisine" : "Italian",

          "name" : "Vella",

          "restaurant_id" : "41704620",

          "grades" : [

            {

              "date" : "2014-10-01T00:00:00",

              "grade" : "A",

              "score" : 11.0

            },

            {

              "date" : "2014-01-16T00:00:00",

              "grade" : "B",

              "score" : 17.0

            }

          ],

          "address" : {

            "building" : "1480",

            "street" : "2 Avenue",

            "zipcode" : "10075",

            "coord" : [

              -73.9557413,

              40.7720266

            ]

          },

          "borough" : "Manhattan"

        }

      }

    ]

  }

}
Looking at /var/log/elasticsearch/elasticsearch-2017-02-26.log
[2017-02-26T21:43:19,969][INFO ][o.e.c.m.MetaDataCreateIndexService] [6MF9SUR] [flkdb] creating index, cause [auto(bulk api)], templates [], shards [5]/[1], mappings []

[2017-02-26T21:43:20,102][INFO ][o.e.c.m.MetaDataMappingService] [6MF9SUR] [flkdb/tpD9koDVRFiQ8P7Jlc-0ug] create_mapping [flikr]
Though I am able to see this using CURL but not able to visualize through Kibana UI, seeing below error. Please help me if anyone has solution around this.
tail -200f /opt/python/bin/mongo-connector.log
2017-02-26 21:07:51,066 [ALWAYS] mongo_connector.connector:52 - Starting mongo-connector version: 2.5.0

2017-02-26 21:07:51,066 [ALWAYS] mongo_connector.connector:52 - Python version: 2.7.13 (default, Feb 20 2017, 21:22:25)

[GCC 4.8.5 20150623 (Red Hat 4.8.5-11)]

2017-02-26 21:07:51,067 [ALWAYS] mongo_connector.connector:52 - Platform: Linux-3.10.0-514.6.1.el7.x86_64-x86_64-with-redhat-7.3-Maipo

2017-02-26 21:07:51,067 [ALWAYS] mongo_connector.connector:52 - pymongo version: 3.4.0

2017-02-26 21:07:51,073 [ALWAYS] mongo_connector.connector:52 - Source MongoDB version: 3.2.10

2017-02-26 21:07:51,073 [ALWAYS] mongo_connector.connector:52 - Target DocManager: mongo_connector.doc_managers.elastic2_doc_manager version: 0.3.0

2017-02-26 21:43:19,943 [WARNING] elasticsearch:94 - PUT http://server1:9200/flkdb/_mapping/flikr [status:404 request:0.006s]

2017-02-26 21:43:19,944 [ERROR] mongo_connector.oplog_manager:288 - Unable to process oplog document {u'h': -5141861334750730480L, u'ts': Timestamp(1488163399, 1), u'o': {u'create': u'flikr'}, u't': 4L, u'v': 2, u'ns': u'flkdb.$cmd', u'op': u'c'}

Traceback (most recent call last):

  File "/opt/python/lib/python2.7/site-packages/mongo_connector/oplog_manager.py", line 283, in run

    timestamp)

  File "/opt/python/lib/python2.7/site-packages/mongo_connector/util.py", line 44, in wrapped

    reraise(new_type, exc_value, exc_tb)

  File "/opt/python/lib/python2.7/site-packages/mongo_connector/util.py", line 33, in wrapped

    return f(*args, **kwargs)

  File "/opt/python/lib/python2.7/site-packages/mongo_connector/doc_managers/elastic2_doc_manager.py", line 246, in handle_command

    "_source": {"enabled": True}

  File "/opt/python/lib/python2.7/site-packages/elasticsearch/client/utils.py", line 73, in _wrapped

    return func(*args, params=params, **kwargs)

  File "/opt/python/lib/python2.7/site-packages/elasticsearch/client/indices.py", line 282, in put_mapping

    '_mapping', doc_type), params=params, body=body)

  File "/opt/python/lib/python2.7/site-packages/elasticsearch/transport.py", line 318, in perform_request

    status, headers, data = connection.perform_request(method, url, params, body, ignore=ignore, timeout=timeout)

  File "/opt/python/lib/python2.7/site-packages/elasticsearch/connection/http_urllib3.py", line 128, in perform_request

    self._raise_error(response.status, raw_data)

  File "/opt/python/lib/python2.7/site-packages/elasticsearch/connection/base.py", line 122, in _raise_error

    raise HTTP_EXCEPTIONS.get(status_code, TransportError)(status_code, error_message, additional_info)

OperationFailed: TransportError(404, u'index_not_found_exception', u'no such index')
I have below issues if anyone can help me on this,
Q-1 : Why elasticsearch consumes more space in /var/lib/elasticsearch/nodes/0 ? is there any way to implement some rotate solution here without impacting indexes?
Q-2 : Not able to visualize mongo documents in kibana, though seeing them loaded in elasticsearch using curl command
I am uploading pdf with above contents if anyone need as document.
ELK with Oracle and MongoDB Step by Step guide
Thanks for checking this.
